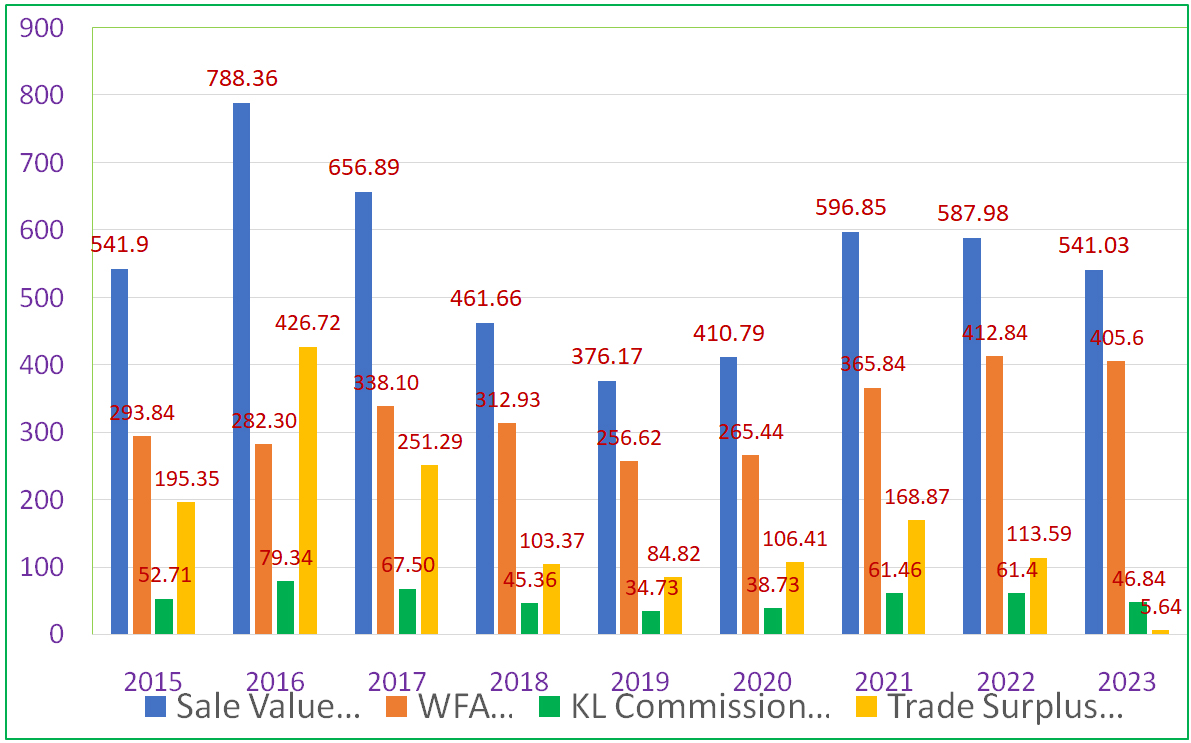
Sale Value, KL Commission and Trade Surplus
|
Year |
QuantityProduced In Lakh Qtls. |
Quantity Sold In Lakh Qtls. |
Sale Value In Crores |
WFA In Crores |
KL Commission In Crores |
Trade Surplus In Crores |
|
2015 |
3.758 |
3.758 |
541.90 |
293.84 |
52.71 |
195.35 |
|
2016 |
3.270 |
3.270 |
788.36 |
282.30 |
79.34 |
426.72 |
|
2017 |
3.559 |
3.559 |
656.89 |
338.10 |
67.50 |
251.29 |
|
2018 |
2.841 |
2.841 |
461.66 |
312.93 |
45.36 |
103.37 |
|
2019 |
2.033 |
2.033 |
376.17 |
256.62 |
34.73 |
84.82 |
|
2020 |
1.902 |
1.902 |
410.79 |
265.44 |
38.73 |
106.41 |
|
2021 |
2.650 |
2.650 |
596.85 |
365.84 |
61.46 |
168.87 |
|
2022 |
2.785 |
2.785 |
587.98 |
412.84 |
61.40 |
113.59 |
|
2023 |
2.652 |
2.51 |
552.67 |
405.60 |
56.35 |
89.04 |
|
2024 |
2.457 |
2.07 |
531.16 |
474.98 |
55.00 |
- |